Data processing is performed using scripts and notebooks developed in R or Python. Predefined environment templates allow users to begin working immediately, eliminating the need for time-consuming configuration and software installation.
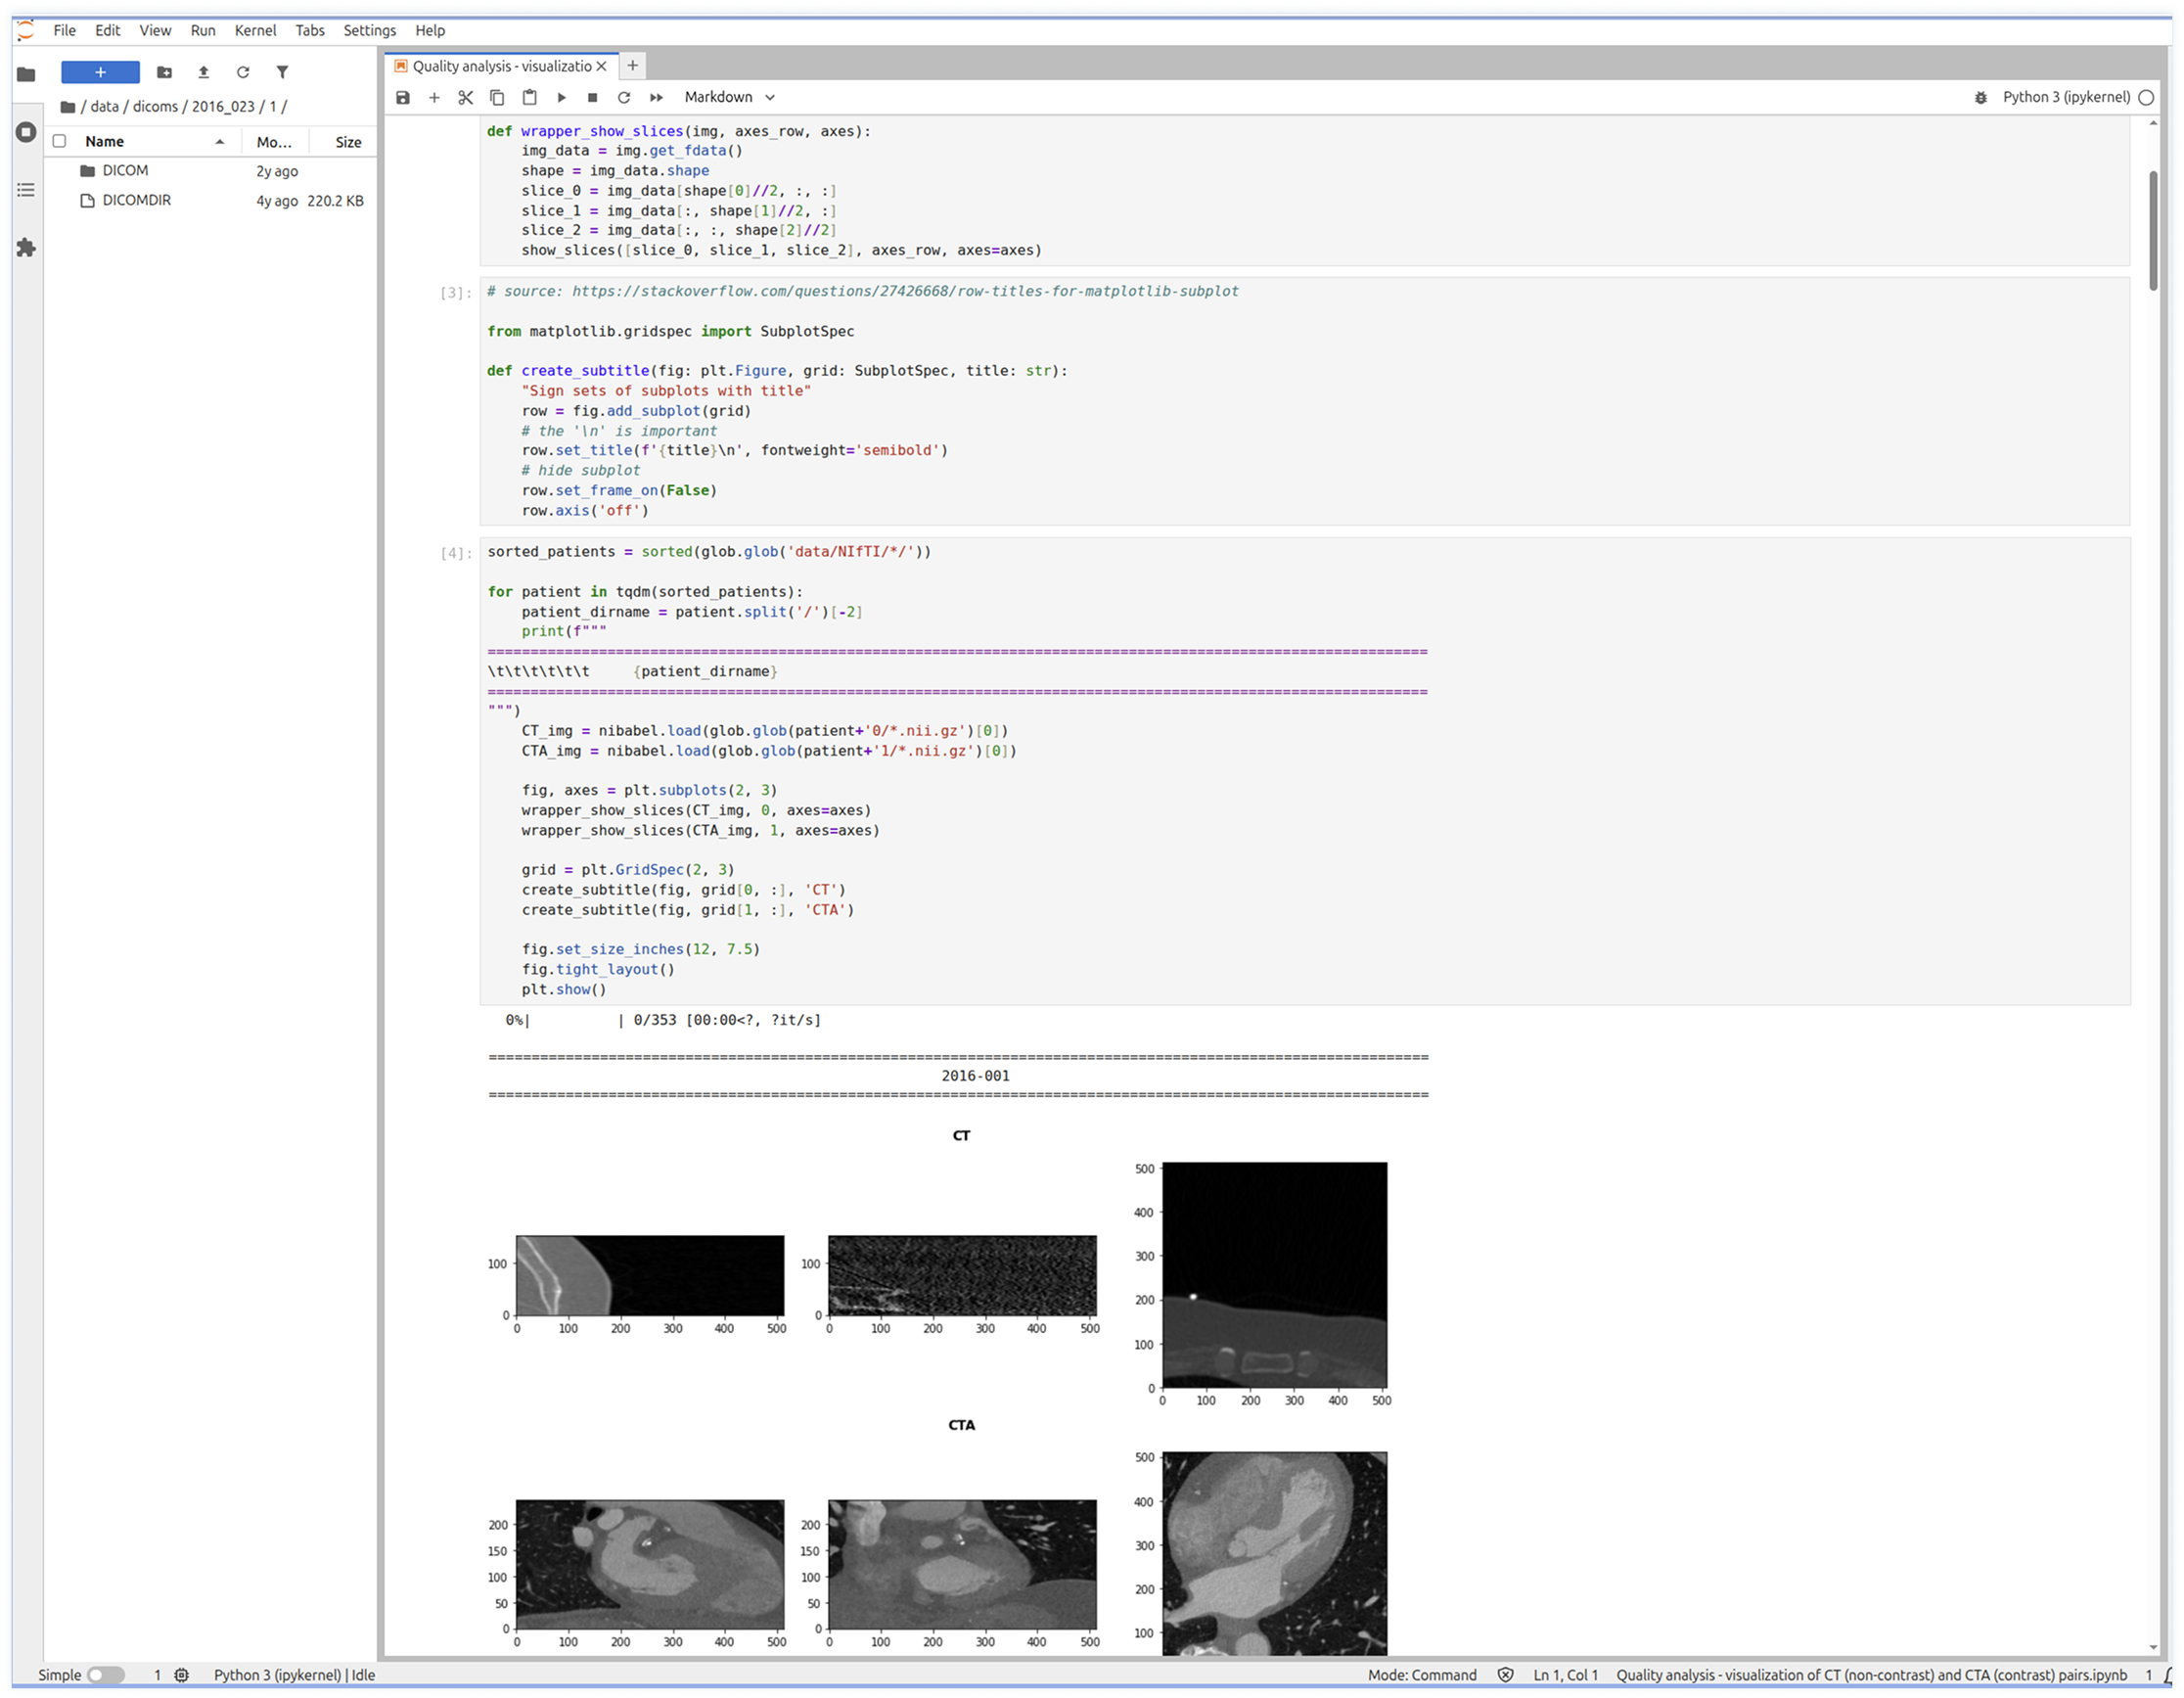
The MOSAIC platform supports a wide range of standard biomedical data formats, including genomic, transcriptomic, proteomic, clinical, and medical imaging data such as DICOM. Integrated visualization capabilities enable rapid exploration of datasets and analytical results.
These tools support efficient prototyping, continuous validation of analytical approaches, and transparent monitoring of project progress.
More AI-assisted Data Analysis
Data Processing and Visualization
Explore and process biomedical data using R/Python with integrated visualization tools for fast exploratory analysis.